The honest opening line: no single number can answer what a battery energy storage system cost is, because the system is a stack of hardware and soft costs whose shares shift with scale, chemistry and site conditions — but the stack itself is predictable, and so is the return model built on it. For a buyer the useful question is never only how much but what is inside the number and which line item is inflating it. This guide names the line items, gives the share bands that reputable quotations should fall inside, and then shows how to model the three value streams that pay the stack back — so a proposal can be tested before it is signed.
Cost conversations fail in two predictable ways: a buyer compares one lump-sum price against another without checking the scope inside each number, or a salesman’s ROI model quietly assumes the battery captures every possible revenue at once. Both failures are avoidable with the same tool — a transparent cost and value framework. Residential readers should cross-reference the single-battery price walkthrough in #07 how much a solar battery costs; the commercial segment’s economics have their own context in #05 commercial battery storage. This page stays at system level: cost structure first, returns second.
The cost stack: what the quotation is actually paying for
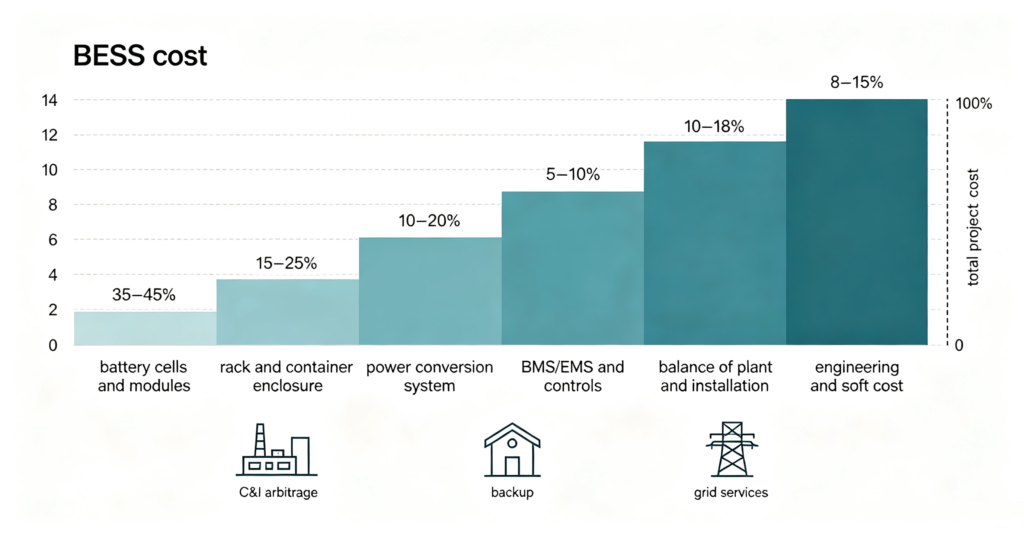
Every BESS quotation, from a garage wall unit to a containerised megawatt-hour plant, is assembled from the same families of line items. The share of each changes with scale — small systems carry proportionally more installation and soft cost; large systems concentrate value in the battery and power electronics. The bands below are directional planning ranges, not market prices: exact figures move with chemistry, region, volumes and specification, and they must always be confirmed against the quotation.
| Cost line | Typical share of project cost | What drives it | Negotiation lever |
|---|---|---|---|
| Battery cells and modules | 40–60% | Cell chemistry, capacity, cycle-life grade, brand | Cell source, specification vs need |
| Rack, enclosure, container | 8–15% | Form factor, ingress protection, fire-rated build | Standardised vs bespoke enclosure |
| Power conversion system (PCS) | 10–15% | Rating, topology, grid codes supported | Single vs modular units |
| BMS, EMS and controls | 5–10% | Balancing grade, protocol support, software scope | Feature list discipline |
| Installation, wiring, protection | 8–15% | Site conditions, labour, electrical work | Prefab integration |
| Engineering, permits, soft cost | 5–15% | Design, compliance, grid application, financing | Project standardisation |
Two patterns in the table matter more than the exact percentages. First, the battery is usually the largest line — so buyers who over-specify cycle life or capacity pay their mistake for the life of the asset; matching specification to duty is the single biggest cost control (the lifetime-vs-price trade-off is analysed in #46 cycle life vs price). Second, the ratio between hardware and everything else shifts hard with scale, which is why comparing a €-per-kWh figure from a residential quote against a utility figure is meaningless — the denominators are different animals.
Cost per kWh hides more than it reveals
The metric everyone asks for first — price per kilowatt-hour — is also the easiest to misread, because it can be computed over nominal capacity or usable capacity, with or without the PCS, with or without installation, before or after tax credits. A quotation that quotes a low per-kWh number usually moved the excluded scope somewhere else. The disciplined habit: ask for two numbers — system price per usable kWh including the conversion and management hardware, and installed project price per usable kWh including site work. The gap between them is the real cost of getting storage onto a specific site. The full bill of materials that defines usable and nominal is walked through in #52 BESS components.
A worked example shows how fast the comparison breaks. Bid A states a low price per nominal kilowatt-hour and lists the power conversion and management hardware as optional extras; Bid B states a higher price per usable kilowatt-hour and includes everything. A buyer comparing only the headline numbers picks A; a buyer comparing installed, usable, all-in numbers usually picks B — and the two bids may in fact be the same hardware from the same factory. The remedy is mechanical: demand that every quotation state usable capacity, include conversion and management in the number, and separate hardware price from site work. Once the scope is identical, price competition becomes real instead of cosmetic.
The three value streams that pay the stack back
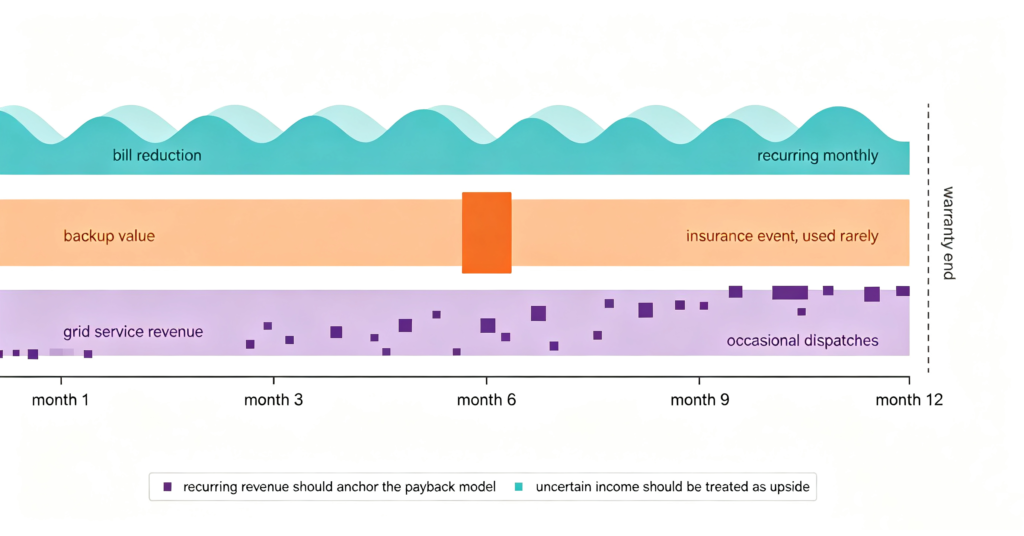
A battery energy storage system cost is recovered through a small set of mechanisms, and honest ROI models stack only the ones a given site can actually capture. For a C&I or utility project the three dominant streams are:
- Bill reduction — cutting demand charges and shifting consumption from expensive tariff periods to cheaper ones. The value is real and recurring, and it scales with the spread between tariff periods and the site’s load shape.
- Backup and resilience value — avoided outage losses and continuity for critical operations. Treated as insurance: genuinely valuable, but it should not be booked as a revenue line.
- Grid services and market participation — frequency response, capacity, or wholesale trading where the market allows it. Often the largest potential revenue and the least certain, subject to market rules and dispatch behaviour.
The residential version of the same logic is simpler: self-consumption savings, backup value, and export or tariff mechanisms where they exist. The full residential economics treatment is in #27 solar self-consumption economics. Whatever the segment, one rule keeps every model honest: count only the energy the system can physically capture — usable capacity minus round-trip losses minus the duty the battery cannot serve because it is already serving something else. Double-counting the same kilowatt-hour across two value streams is the most common reason projected paybacks fail in the field.
A site-level ROI sanity check
| Input | How to test it | Why it decides the deal |
|---|---|---|
| Load profile | Read half-hourly data across seasons | Storage only earns on the load it can actually shift |
| Tariff structure | Confirm demand charges and period spreads in writing | Defines bill-reduction revenue ceiling |
| Usable capacity and efficiency | Use DoD limits and round-trip efficiency from the datasheet | Converts nameplate kWh into earning kWh |
| Duty and cycle budget | Match cycle-life grade to daily depth of operation | Over-spec adds cost; under-spec shortens asset life |
| Value assumptions | Separate recurring revenue from one-off or uncertain income | Keeps the payback projection defensible |
| O&M and degradation | Include service cost and capacity fade over the warranty term | Real payback is a lifecycle number, not a first-year one |
Payback conversations should be framed as a band, not a point: sites with strong tariff spreads and good load shapes see returns at the fast end; sites with flat tariffs and no peak to shave should be told honestly that storage may not be the best investment this year. A supplier who explains the band and the conditions is more useful than one who promises a single confident year. The utility-scale cousin of this analysis — where market revenue dominates — is covered in #22 utility-scale storage.
Procurement checklist: what the quote must state
- Price basis: nominal vs usable kWh, and whether PCS, BMS, EMS and enclosure are inside the number
- Warranty terms: throughput, calendar years, capacity-retention curve and what voids it
- Cycle-life grade and the duty it supports at the proposed operating depth
- Delivery scope: freight, installation, commissioning and grid connection responsibilities
- Soft-cost items: engineering, permits, certification documentation and testing
- O&M: what is included, for how long, and remote diagnostics access
The same checklist applies whether the project is one home unit or a container fleet — the difference is only the size of the line items. A battery energy storage system cost that is quoted as a transparent stack against this checklist is a quote you can compare; one that arrives as a single opaque number is a negotiation, not a quotation.
Where the numbers come from and how to keep them honest
This guide deliberately avoids printing a market price per kilowatt-hour: storage pricing moves with cell supply, region and specification, and a figure published today becomes a wrong assumption tomorrow. Instead it gives the buyer a replicable method — decompose the quote into the share bands above, verify the tariff and load inputs, book only physical energy into the model, and treat uncertain revenue as upside rather than income. Industry pricing benchmarks and cell-price trends are published regularly by research houses such as BloombergNEF, Wood Mackenzie and the International Energy Agency; buyers should pull the freshest benchmark at the time of purchase rather than rely on an article’s numbers. The same no-fabricated-numbers discipline applies across this site’s economics guides, including #46 the lifetime cost comparison.
Q. What does a battery energy storage system cost in 2026?
There is no single answer: price per usable kWh falls sharply as scale rises, and residential, C&I and utility projects quote on different scopes. The disciplined way to compare is to ask suppliers for price per usable kWh including conversion and management hardware, then check the quote against the cost-stack bands above with current published benchmarks.
Q. Is battery storage worth it financially?
It depends on the tariff spread, the load profile and whether backup value matters to you. Sites with strong peak demand charges or wide day-night spreads can see fast returns; flat-tariff sites often cannot justify storage on bill savings alone and should value resilience or other streams before buying.
Q. Why is the battery the biggest cost line?
Cells and modules are the energy-carrying core of the system and typically represent around half of project cost at system level. That is why over-specifying capacity or cycle life is the most expensive mistake in storage procurement — every unnecessary cell is paid for up front and again in the ROI that never arrives.
Q. How long does a BESS take to pay for itself?
Payback depends on captured value, not on hardware price alone. Well-structured C&I projects with strong demand charges can pay back in a few years; marginal projects may never pay back on bill savings alone. Model the band with the site’s own data, then decide.
Q. What is the biggest hidden cost in storage projects?
Soft cost and scope drift: engineering, permits, grid-connection work, protection upgrades and installation surprises that sit outside the headline battery price. Buyers who compare only hardware prices discover the gap at the end. Ask for installed project price, not equipment price.
Next step: get a quote you can actually compare
Send leekooenergy your load data and tariff structure and receive a cost stack itemised against this checklist.
- Understand the hardware inside the price via #52 BESS components
- Check the lifetime trade-off in #46 cycle life vs price
- Model residential self-consumption with #27 self-consumption economics
- Ask for a leekooenergy quotation that states usable-kWh price, warranty curve and installed scope in one page