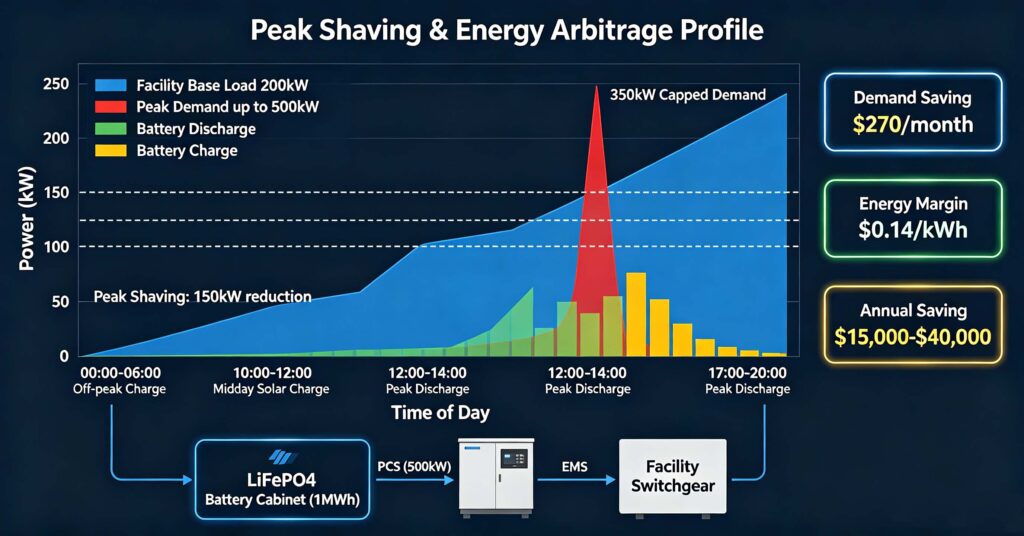
Peak shaving energy arbitrage are the two primary revenue streams for commercial and industrial (C&I) battery energy storage systems (BESS), and they work together to reduce electricity costs and generate a return on investment. Peak shaving (also called demand charge management) uses the battery to discharge during periods of high facility power demand, reducing the peak demand measured by the utility meter — this directly reduces demand charges, which are typically billed at $5–$25 per kW per month and can make up 30–50% of a C&I facility’s electricity bill. Energy arbitrage (also called time-of-use arbitrage) charges the battery during low-rate periods (off-peak, typically nighttime) and discharges during high-rate periods (on-peak, typically afternoon/evening), capturing the price difference — typical arbitrage spreads are $0.05–$0.20 per kWh. A well-designed C&I BESS combines both strategies: the battery is programmed by an energy management system (EMS) to charge during off-peak hours (low rate, low demand), discharge during on-peak hours (high rate) while also capping peak demand (reducing demand charges), and potentially participate in utility demand response programs for additional revenue. The ROI for a C&I BESS depends on electricity rates, demand charges, system size, and utilization — typical payback periods are 4–8 years for facilities with high demand charges ($15+/kW) and favorable time-of-use rates, with internal rates of return (IRR) of 12–25%. A typical C&I BESS uses 100kWh–2MWh of LiFePO4 battery capacity, paired with a 50kW–1MW power conversion system (PCS) and an EMS that optimizes charge/discharge in real time based on utility rates, facility demand, and weather forecasts.
For commercial and industrial facilities, electricity costs are often one of the largest operating expenses — and peak shaving energy arbitrage with battery storage has emerged as one of the most effective ways to reduce those costs. Unlike residential solar storage, which primarily provides backup power and self-consumption, C&I battery storage is designed as a financial asset that generates measurable returns through demand charge reduction and time-of-use arbitrage. This playbook explains how peak shaving and energy arbitrage work, provides the formulas to calculate ROI, analyzes a realistic case study, and covers the system configuration and risks. For C&I battery hardware (cabinets, fireproof enclosures), see #104 battery cabinet & fireproof storage C&I guide.
Peak shaving vs energy arbitrage: two complementary revenue streams
Peak shaving and energy arbitrage are often discussed together, but they are distinct strategies that target different components of a C&I electricity bill. Understanding the difference is essential for designing a BESS that maximizes ROI.
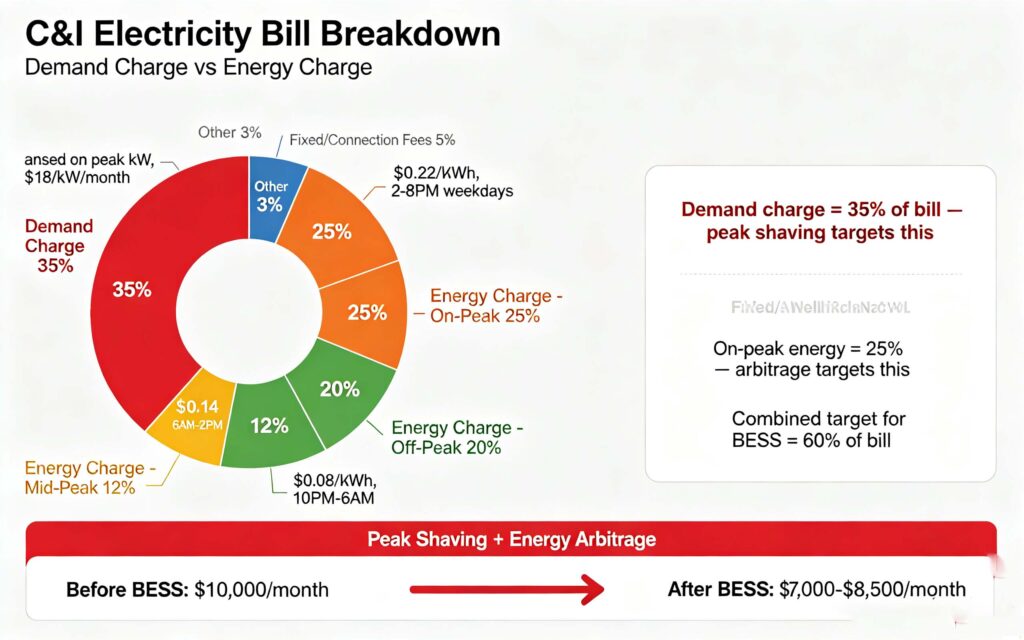
Peak shaving (demand charge management) targets the demand charge portion of the bill. C&I electricity bills typically have two components: energy charges ($/kWh, based on total consumption) and demand charges ($/kW, based on the highest 15-minute or 30-minute average power draw during the billing period). Demand charges can make up 30–50% of a C&I bill, especially for facilities with high peak-to-average demand ratios (manufacturing, data centers, restaurants with HVAC peaks). Peak shaving works by discharging the battery during periods when facility demand is high, reducing the net demand seen by the utility meter. For example, if a facility normally peaks at 500kW and the battery discharges at 150kW during the peak, the measured peak is 350kW — reducing demand charges by 150kW × $18/kW = $2,700 per month (at $18/kW demand rate).
Energy arbitrage (time-of-use arbitrage) targets the energy charge portion of the bill. Many utilities offer time-of-use (TOU) rates with different prices for on-peak, mid-peak, and off-peak periods. Energy arbitrage works by charging the battery during low-rate periods (off-peak, typically nighttime 10PM–6AM) and discharging during high-rate periods (on-peak, typically afternoon 2PM–8PM). The profit per kWh is the difference between on-peak and off-peak rates. For example, if off-peak rate is $0.08/kWh and on-peak rate is $0.22/kWh, the arbitrage spread is $0.14/kWh. A 1MWh battery cycled once per day generates $0.14 × 1,000 × 365 = $51,100 per year in arbitrage revenue (before efficiency losses).
The two strategies are complementary: a well-programmed EMS charges the battery during off-peak hours (low rate, low demand), then discharges during on-peak hours to both capture arbitrage profits and cap peak demand. The battery may also charge from on-site solar during midday (if available) and participate in demand response programs (receiving payments from the utility for reducing demand during grid stress events).
| Factor | Peak Shaving | Energy Arbitrage |
|---|---|---|
| Bill component targeted | Demand charge ($/kW) | Energy charge ($/kWh) |
| How it works | Battery discharges during high-demand periods to cap peak kW | Battery charges at low rate, discharges at high rate |
| Typical savings | $1,000–$10,000+/month | $0.05–$0.20/kWh per cycle |
| Key driver | Demand charge rate ($/kW) and peak-to-average ratio | TOU rate spread ($/kWh difference) |
| Battery sizing emphasis | Power (kW) — enough to shave the peak | Energy (kWh) — enough for daily cycle |
| Best for | Manufacturing, data centers, facilities with high demand charges | Facilities with favorable TOU rates, 24/7 operations |
C&I BESS ROI calculation: formulas and case study
Calculating the ROI for a C&I BESS requires estimating annual savings from peak shaving and energy arbitrage, subtracting operating costs, and comparing to the initial investment. The key formulas are:
Annual peak shaving savings = Peak reduction (kW) × Demand charge rate ($/kW/month) × 12 months
Annual energy arbitrage revenue = Battery capacity (kWh) × Daily cycles × Round-trip efficiency × Arbitrage spread ($/kWh) × 365 days
Total annual savings = Peak shaving savings + Arbitrage revenue + Demand response payments (if applicable) + Other incentives (if applicable)
Simple payback period = Initial investment ($) / Total annual savings ($/year)
Internal rate of return (IRR) = The discount rate that makes net present value (NPV) of cash flows zero — typically calculated over 10–15 year system life
Case study: A 200,000 sq ft manufacturing facility with a 500kW peak demand, $18/kW demand charge, and TOU rates of $0.08/kWh off-peak and $0.22/kWh on-peak installs a 500kW/1MWh LiFePO4 BESS at a total installed cost of $350,000 ($350/kWh). The EMS is programmed to: (1) charge 1MWh during off-peak (10PM–6AM) at $0.08/kWh; (2) discharge 500kW for 2 hours during the afternoon peak (1–3PM) to cap demand at 350kW (reducing peak by 150kW) while selling energy at $0.22/kWh; (3) discharge remaining 500kWh during evening peak (5–8PM) at $0.22/kWh.
Annual peak shaving savings = 150kW × $18/kW/month × 12 = $32,400/year
Annual arbitrage revenue = 1,000kWh × 1 cycle/day × 0.90 efficiency × $0.14/kWh × 365 = $45,990/year
Total annual savings = $32,400 + $45,990 = $78,390/year
Simple payback = $350,000 / $78,390 = 4.5 years
Over a 15-year system life, total savings = $78,390 × 15 = $1,175,850, with net profit of $825,850 (after initial investment). IRR ≈ 22%. This case study demonstrates why C&I BESS has become an attractive investment for facilities with high demand charges and favorable TOU rates.
C&I BESS system configuration and key components
A C&I BESS for peak shaving and energy arbitrage consists of five main components: battery bank, power conversion system (PCS), energy management system (EMS), switchgear/transformer, and enclosure/cooling.
Battery bank: LiFePO4 is the standard chemistry for C&I BESS due to long cycle life (6,000–10,000 cycles), high depth of discharge (80–90%), and safety. C&I systems typically use 100kWh–10MWh of capacity, configured as 51.2V or 768V battery modules connected in series/parallel to achieve the desired DC voltage (typically 600–1500V for utility-scale PCS).
Power conversion system (PCS): The PCS is a bidirectional inverter that converts DC from the battery to AC for the facility, and AC from the grid/solar to DC for charging. C&I PCS ratings range from 50kW to 10MW, with 97–98% efficiency. The PCS must support grid-tie operation (synchronization with grid frequency/voltage) and islanding mode (for backup power during outages, if required).
Energy management system (EMS): The EMS is the brain of the system — it uses algorithms to optimize charge/discharge in real time based on: utility rate schedules (TOU, demand charges), facility load forecasts (historical data + weather), solar production forecasts (if on-site solar), battery state of charge and health, and demand response signals. A sophisticated EMS can increase annual savings by 10–20% compared to a simple fixed schedule.
Switchgear and transformer: The BESS connects to the facility’s electrical system through a transformer (to match facility voltage, typically 480V or 208V in the US) and switchgear (breakers, disconnects, protection relays). The interconnection must comply with local utility requirements and IEEE 1547 standards.
Enclosure and cooling: C&I BESS is typically housed in outdoor cabinets or containers (ISO shipping containers for systems >500kWh). Thermal management is critical — LiFePO4 batteries operate best at 15–30°C, and high temperatures accelerate aging. Most C&I systems use active cooling (HVAC or liquid cooling) to maintain uniform temperature. For more details on C&I battery cabinets and fireproof enclosures, see #104 battery cabinet & fireproof storage C&I guide.
Q. How does peak shaving work with battery storage?
Peak shaving discharges the battery when facility demand is highest, trimming the peak demand the utility meter records. C&I bills charge demand on the highest 15-30 minute average draw, typically $5-$25 per kW per month. If a plant peaks at 500kW and a 200kW battery discharges during that window, the measured peak drops to 300kW, saving 200 x $18 = $3,600 a month. An EMS monitors demand in real time and discharges only when demand crosses a set threshold, then recharges off-peak.
Q. What is the typical payback period for C&I battery storage?
Typically 4-8 years. Facilities with demand charges above $15/kW and rate spreads above $0.10/kWh reach payback in 4-6 years; moderate sites take 6-8. Low demand charges under $8/kW may not justify a system without extra revenue streams like demand response. What shortens payback: high demand rates, sharp demand peaks, large TOU spreads, 1+ cycles a day, the 30% federal credit, and installed costs near $300-$400 per kWh. Over a 15-year life, net profit can reach 2-4 times the investment, with IRR of 12-25%.
Q. How do I calculate energy arbitrage revenue for battery storage?
Multiply usable capacity by daily cycles, round-trip efficiency, the arbitrage spread, and operating days: annual revenue equals kWh x DoD x cycles per day x efficiency x spread x operating days. Example: a 1MWh battery, 90% usable, one cycle daily, 90% efficiency, $0.14 spread, and 360 days gives 1,000 x 0.90 x 1 x 0.90 x 0.14 x 360 = $40,824 a year. Round-trip efficiency combines battery, 90-95%, and PCS, 97-98%. Spread is the on-peak minus off-peak energy rate. Degradation lowers revenue over time; a smart EMS adds 10-20%.
Q. What size C&I battery system do I need for peak shaving?
Size power in kW to the peak reduction you want and energy in kWh to the duration of peak events. Power: aim for 20-50% of your peak demand; to cut a 500kW peak to 350kW you need 150kW of continuous discharge. Energy: a 150kW discharge lasting two hours needs at least 300kWh usable, so most systems use a 2:1 to 4:1 energy-to-power ratio, such as a 500kW PCS with 1-2MWh. Typical sizes: retail and office 100-300kW, warehouse 300-750kW, industrial 750kW-5MW. Analyze 12 months of 15-minute interval data first.
Q. What are the risks and challenges of C&I battery storage for peak shaving?
Main risks: utility rate changes reducing demand charges or TOU spreads; battery degradation cutting capacity to 70-80% after 10-15 years; interconnection delays and upgrade costs of $10,000-$50,000 or more; a poorly tuned EMS leaving savings on the table; ongoing maintenance at 1-2% of cost yearly; and safety compliance with NFPA 855 and UL 9540. Mitigate with a site-specific ROI model, performance guarantees, an experienced EMS, and verified assumptions. A PPA or energy-storage-as-a-service model shifts performance and degradation risk to the provider.
Next step: analyze your interval data and model your BESS ROI
Peak shaving energy arbitrage with C&I battery storage can deliver 4–8 year payback and 12–25% IRR for facilities with high demand charges and favorable TOU rates — but the ROI depends entirely on your specific electricity rates, load profile, and system design. The first step is to obtain 12 months of 15-minute interval data from your utility meter and have a BESS provider perform a detailed load analysis and ROI modeling. Never invest in a C&I BESS based on generic savings estimates — always require a site-specific analysis with verified assumptions.
- Learn about C&I battery cabinets and enclosures in #104
- Read industrial energy storage applications in #15
- Understand liquid cooling for C&I BESS in #88
- Review battery safety and NFPA 855 in #87
- Ask leekooenergy for a C&I BESS peak shaving and energy arbitrage feasibility study that includes: analysis of your 12-month 15-minute interval data (peak demand, load profile, peak-to-average ratio), calculation of current demand charges and energy charges by TOU period, recommended system size (kW PCS and kWh battery) optimized for your load profile, projected annual savings from peak shaving (demand charge reduction), projected annual revenue from energy arbitrage (TOU spread), additional revenue opportunities (demand response, solar self-consumption, ancillary services), total installed cost estimate (battery, PCS, EMS, switchgear, enclosure, installation, interconnection), simple payback period and 15-year IRR/NPV analysis, sensitivity analysis (rate changes, degradation, utilization), recommended financing model (direct purchase, lease, PPA, ESaaS), and system configuration with safety and code compliance (NFPA 855, UL 9540) — so your C&I BESS investment is based on verified data and realistic ROI projections