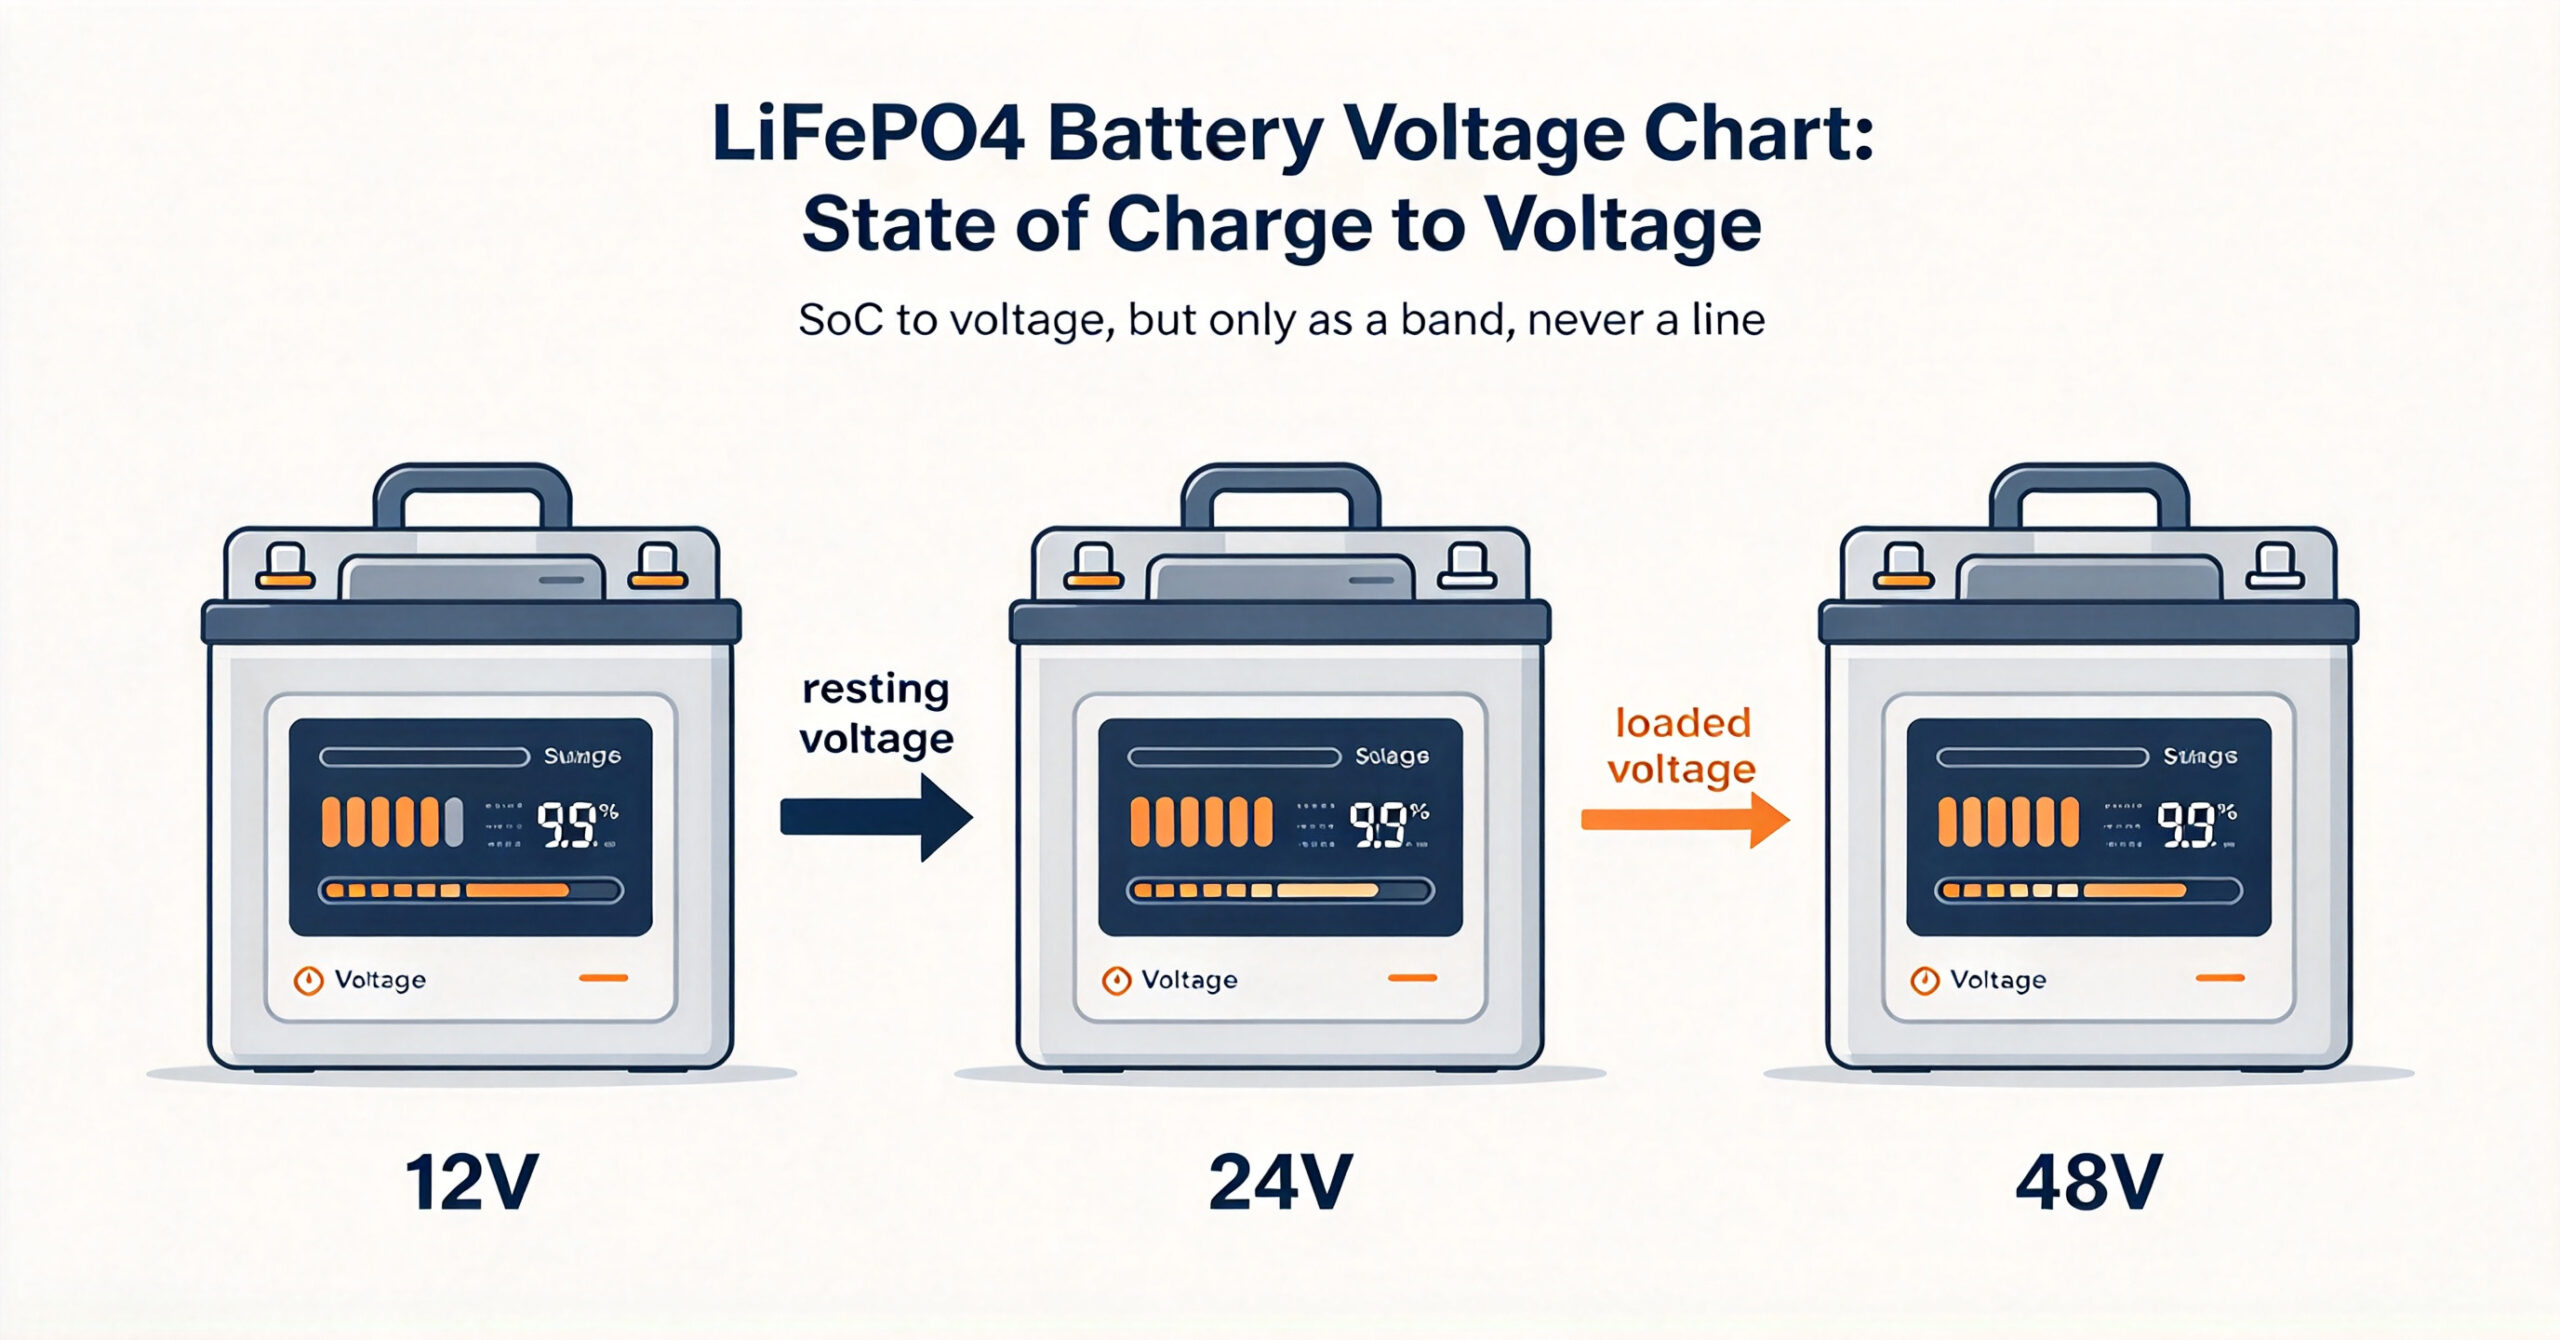
A lifepo4 battery voltage chart maps a LiFePO4 pack’s state of charge (SoC) to its terminal voltage, shown here for 12V, 24V and 48V systems as both open-circuit resting voltage and under-load voltage ranges rather than single numbers. Because LiFePO4 has a very flat curve, voltage alone is only a rough SoC clue, and load, temperature and rest time all shift it. This guide gives the chart, explains how to read it, lists the three main error sources, and shows how to use it for field troubleshooting.
The numbers below are general reference ranges for healthy cells at room temperature, not one model’s spec, and they should never replace a coulomb-counting BMS for control. Use the chart to sanity-check a reading, not to run the pack.
The LiFePO4 SoC–voltage reference chart (12V / 24V / 48V)
The table maps state of charge to terminal voltage for the three common LiFePO4 nominal voltages. Each cell shows two figures: the open-circuit resting voltage after the pack has sat without load, and the under-load voltage while delivering current. Because LiFePO4 voltage sags under load and rebounds after rest, a single number would be wrong half the time — treat every value as a band, not a point. Per-cell detail sits in the Li-ion cell voltage guide.
| SoC | 12V OCV | 12V loaded | 24V OCV | 24V loaded | 48V OCV | 48V loaded |
|---|---|---|---|---|---|---|
| 100% | 13.6–13.8 V | 13.0–13.4 V | 27.2–27.6 V | 26.0–27.2 V | 54.4–55.2 V | 52.0–54.4 V |
| 90% | 13.4–13.6 V | 12.8–13.2 V | 26.8–27.2 V | 25.6–26.4 V | 53.6–54.4 V | 51.2–52.8 V |
| 80% | 13.2–13.4 V | 12.6–13.0 V | 26.4–26.8 V | 25.2–26.0 V | 52.8–53.6 V | 50.4–52.0 V |
| 70% | 13.1–13.3 V | 12.4–12.8 V | 26.2–26.6 V | 24.8–25.6 V | 52.4–53.2 V | 49.6–51.2 V |
| 60% | 13.0–13.2 V | 12.2–12.6 V | 26.0–26.4 V | 24.4–25.2 V | 52.0–52.8 V | 48.8–50.4 V |
| 50% | 12.9–13.1 V | 12.0–12.5 V | 25.8–26.2 V | 24.0–25.0 V | 51.6–52.4 V | 48.0–50.0 V |
| 40% | 12.7–13.0 V | 11.8–12.2 V | 25.4–26.0 V | 23.6–24.4 V | 50.8–52.0 V | 47.2–48.8 V |
| 30% | 12.5–12.8 V | 11.5–11.9 V | 25.0–25.6 V | 23.0–23.8 V | 50.0–51.2 V | 46.0–47.6 V |
| 20% | 12.2–12.6 V | 11.0–11.5 V | 24.4–25.2 V | 22.0–23.0 V | 48.8–50.4 V | 44.0–46.0 V |
| 10% | 11.8–12.2 V | 10.5–11.0 V | 23.6–24.4 V | 21.0–22.0 V | 47.2–48.8 V | 42.0–44.0 V |
| 0% | 10.0–11.2 V | 9.5–10.5 V | 20.0–22.4 V | 19.0–21.0 V | 40.0–44.8 V | 38.0–42.0 V |
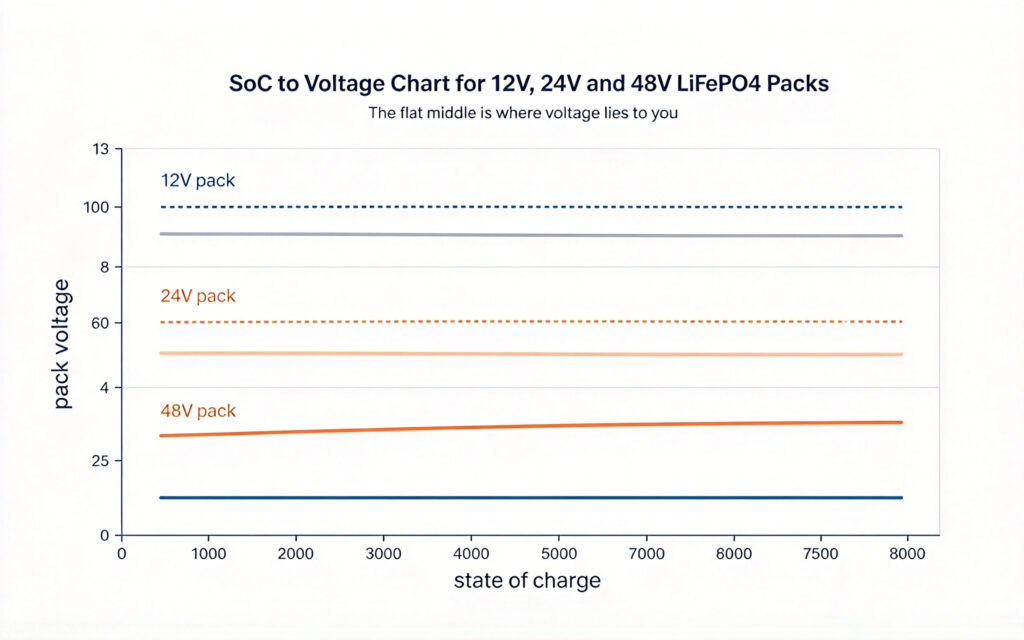
Notice how flat the middle is: between roughly 20 and 80 percent SoC a 12V pack’s open-circuit voltage barely moves, sitting near 12.5 to 13.4 V. That flatness is exactly why this lifepo4 battery voltage chart is only approximate in that region — a small voltage change means a large SoC change, so tiny measurement errors become big SoC errors. The curve steepens only near the top and bottom, where voltage becomes a more reliable, if still rough, indicator. The chemistry that defines this shape is in the lithium iron phosphate batteries guide.
How to read the voltage chart without fooling yourself
First, pick the right column. A “12v lifepo4 state of charge chart” is just the 12V columns above; 24V and 48V use their matching pairs. Read the resting (OCV) column only after the pack has been idle an hour, and the loaded column only while current flows — mixing them is the most common reason a reading looks impossible, and on a 12V build it is the exact trap the 12V LiFePO4 battery guide warns about.
Second, when you use this lifepo4 battery voltage chart, read the value as a band, not a line. If your 12V pack reads 13.0 V resting, the chart puts you in the 60 to 90 percent band — it cannot say whether you are at 65 or 85 percent, because the curve is nearly flat there. Use the chart for full, half or empty, not an exact percentage; trust a coulomb-counting BMS or shunt monitor for the precise figure.
Third, know the full-charge top. The LiFePO4 full charge voltage is around 3.65 V per cell, or about 14.6 V, 29.2 V and 58.4 V for 12V, 24V and 48V packs. If a rested pack sits well below those tops after a full charge, suspect a cell imbalance or a charging fault before blaming the chart.
Error source 1 — temperature
Temperature is the first thing that moves voltage off the chart. Cold packs hold higher voltage at the same SoC because internal resistance rises and the open-circuit potential shifts up, so a rested 12V pack in winter can read near 13.2 V at 50 percent SoC where the room-temperature chart shows 12.9 to 13.1 V. Hot packs read lower and risk an early low-voltage cutoff that wastes usable capacity.
The fix is to treat the chart as a room-temperature baseline and correct in your head: in cold weather a given voltage means slightly lower SoC than the chart implies; in heat, slightly higher. For a system running across seasons, a temperature-compensated BMS or a monitor that knows pack temperature tracks SoC far better than any printed voltage chart.
Error source 2 — charge and discharge rate (C-rate)
The second error source is how hard the pack works. Under a heavy load, internal resistance drops terminal voltage below the resting value — that is the loaded column — and the harder the draw, the wider the gap. A 12V pack at full rated current might sit at 12.0 V loaded where it would rest at 13.0 V, a full band of apparent SoC lost to nothing but sag. Charging shows the mirror image: terminal voltage rides above resting while current flows in.
This is why the chart gives two numbers per SoC, and why a lifepo4 battery voltage chart never replaces a BMS for control. Match your reading to the loaded column under load and the resting column at rest, or you will see false empty alarms. The monitoring that removes this error entirely is the subject of the battery management system 101 guide.
Error source 3 — rest time after load or charge
The third error source is the simplest to forget: time. A LiFePO4 pack’s voltage keeps drifting for minutes to an hour after current stops, as the cells relax. Measure immediately after a load and you catch the sagged, low reading; an hour later the same pack rebounds into the resting band. The chart’s resting figures assume this settle time has passed.
For field work, build in the wait. After removing a load or finishing a charge, let the pack sit with no current for 30 to 60 minutes before trusting a resting-voltage SoC estimate. If you cannot wait, use the loaded column and note it will read low. This habit removes more bad readings than any other, and it is why a quick tap-and-guess check so often disagrees with the BMS. Sizing the bank so the wait is practical is part of the 12V LiFePO4 deep cycle battery hub.

Field troubleshooting with the voltage chart
In the field, use the chart as a contradiction detector rather than a meter. Note the pack voltage, whether it was resting or loaded, and the approximate temperature. A 12V pack reading 11.0 V under a light load is near 10 to 20 percent SoC — expected. The same 11.0 V at rest means near empty, a real warning to stop discharging. For larger banks, the same method is shown at scale in the 48V 300Ah rack mount lithium battery guide.
Cross-check against the BMS SoC readout. When the chart and the BMS agree, you have a confident reading and can act. When they disagree beyond the chart’s band width, run the three errors in order: was it loaded or rested, what was the temperature, and how long since the last current flowed? Most disagreements resolve there without a tool. Only when the chart, a settled resting measurement and the BMS all disagree should you suspect a cell fault, a bad connection or a sensor error worth opening the case for.
For a 48V system the same logic scales up, which is why a lifepo4 battery voltage chart for 48V is just the rightmost pair of columns above. A 48V pack reading 44 V loaded maps to roughly 10 to 20 percent SoC, the same relative position as the 12V pack at 11 V loaded. Keep the ratio in mind and one chart serves every common LiFePO4 nominal voltage. For chisidal racks and 12V banks alike, the chart is a first-pass field check; the BMS remains the authority for day-to-day control and protection.
lifepo4 battery voltage chart
A lifepo4 battery voltage chart maps a LiFePO4 pack’s state of charge to its terminal voltage. This version covers 12V, 24V and 48V systems and shows both open-circuit resting voltage and under-load voltage as ranges, because LiFePO4’s flat curve makes a single voltage number unreliable. Use it as a field sanity check, not as a precise SoC meter.
Q. What voltage is a 12V LiFePO4 battery at 50% charge?
At 50 percent SoC a rested 12V LiFePO4 pack sits near 12.9 to 13.1 V open circuit, and around 12.0 to 12.5 V while under load. Because the curve is nearly flat in the middle, that voltage band covers a wide SoC range, so treat it as about half rather than an exact figure, and confirm with a coulomb-counting monitor.
Q. What is the LiFePO4 full charge voltage?
At the cell level, LiFePO4 full charge voltage at charge termination is around 3.65 V, which scales to about 14.6 V for a 12V pack, 29.2 V for 24V and 58.4 V for 48V. After a full charge and a short rest, a healthy pack should sit near those tops; if it rests well below, suspect imbalance or a charging fault rather than the chart.
Q. Why does my LiFePO4 voltage not match the chart?
Three things move it: temperature (cold reads high, heat reads low), charge or discharge rate (load sags voltage, charge raises it), and rest time (voltage rebounds for up to an hour after current stops). Match your reading to the correct resting or loaded column, correct for temperature, and let the pack settle before trusting a resting estimate.
Q. How accurate is a LiFePO4 voltage chart for SoC?
Only roughly. Near the top and bottom of the curve voltage changes enough to be useful, but between about 20 and 80 percent SoC the curve is so flat that small measurement errors mean large SoC errors. The chart is good for full, half or empty calls and field checks; for exact SoC, use a BMS or shunt-based coulomb counter.
Q. Can I use one chart for 12V, 24V and 48V LiFePO4?
Yes. The shape of the curve is the same; only the voltage scales with the number of cells in series — four cells for 12V, eight for 24V, sixteen for 48V. The table above gives all three side by side, so a 48V reading of 44 V loaded means the same relative SoC as 11 V loaded on a 12V pack. Keep the ratio in mind and one chart covers every common nominal voltage.
Next step: use the chart to sanity-check, then confirm with the BMS
The voltage chart is a fast field check, not the final word. Match your reading to the right column and condition, then let a coulomb-counting BMS carry the day-to-day control. When chart, settled reading and BMS agree, you can act with confidence.
- Review the cell-level detail in the Li-ion cell voltage guide before quoting a per-cell window
- Start from the lithium iron phosphate batteries guide for the chemistry background
- For chisidal, send your usage and site details, and we will come back with product prices, lead time and warranty information.