battery state of health (SOH) is the percentage that shows how much usable capacity a cell or pack still holds compared with its rated capacity when new. It falls as the battery ages through cycling and calendar effects, and it is the number that tells an operator whether a unit still meets its duty or is moving toward replacement.
Most battery reports lead with charge level, yet charge level is not the same as condition. A pack can read full on its gauge and still deliver far less than it did at commissioning, because the cells beneath have quietly shed capacity and gained resistance. battery state of health is the metric that captures that drift, and it is what separates a healthy asset from one slowly losing its value. For teams running storage at commercial scale, SOH turns a vague feeling that a battery seems weaker into a figure they can schedule maintenance and replacement around. This article explains what the number means, how it is measured, which operating choices move it, and how to read it from the system that watches the pack.
What battery state of health means, and how it differs from state of charge
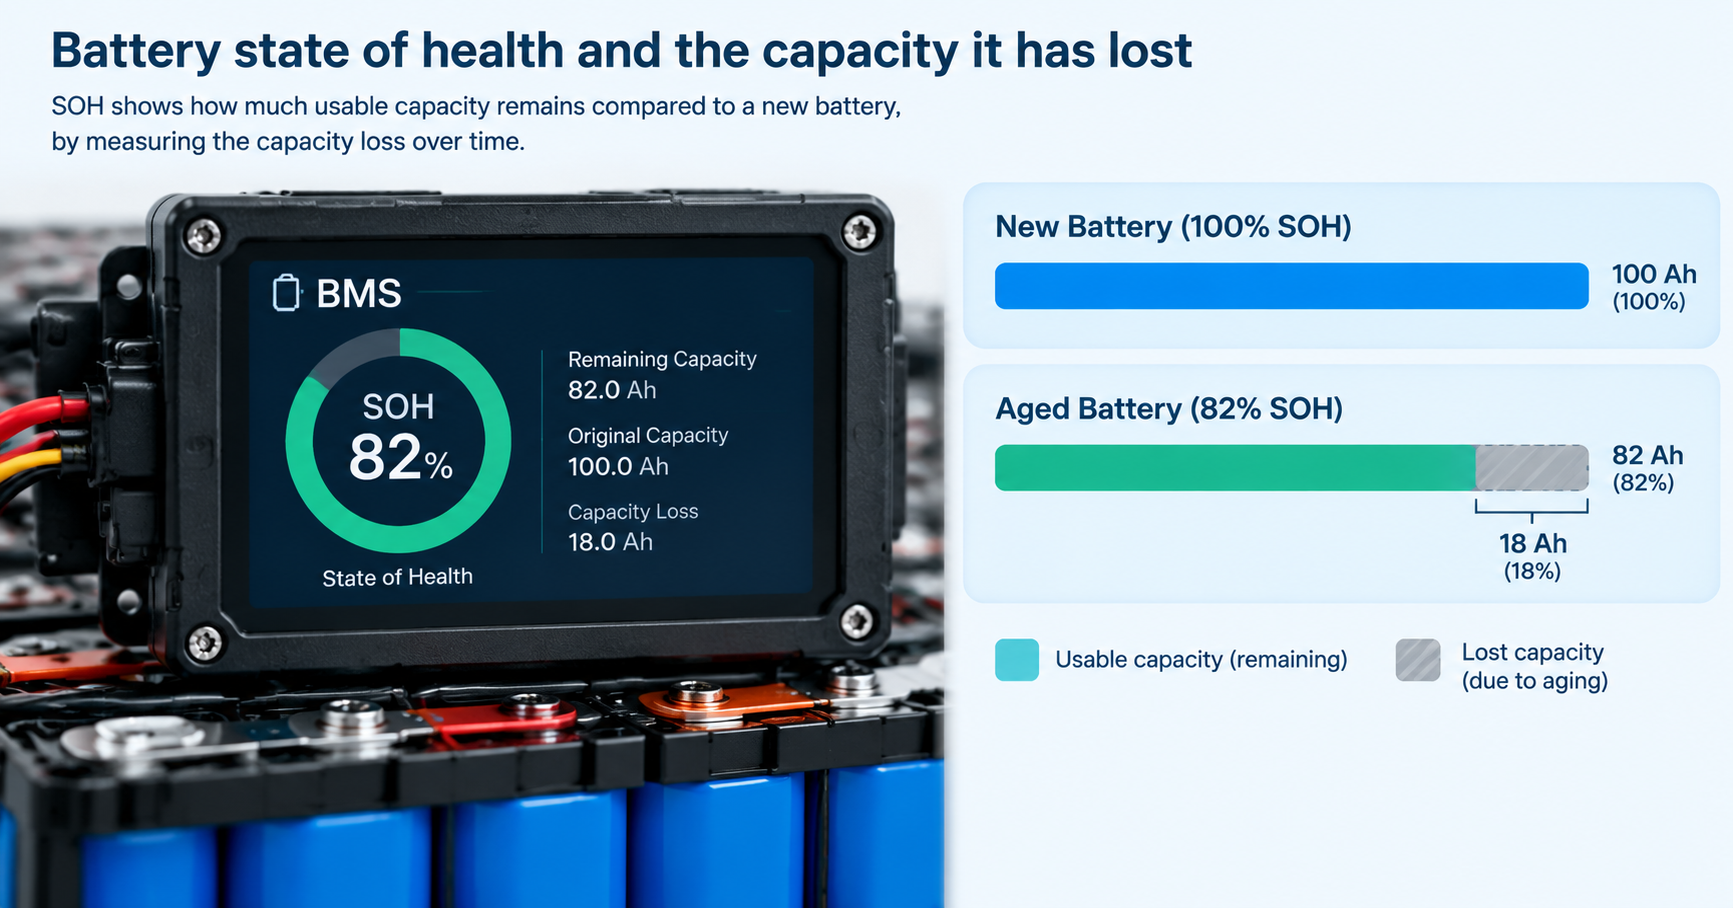
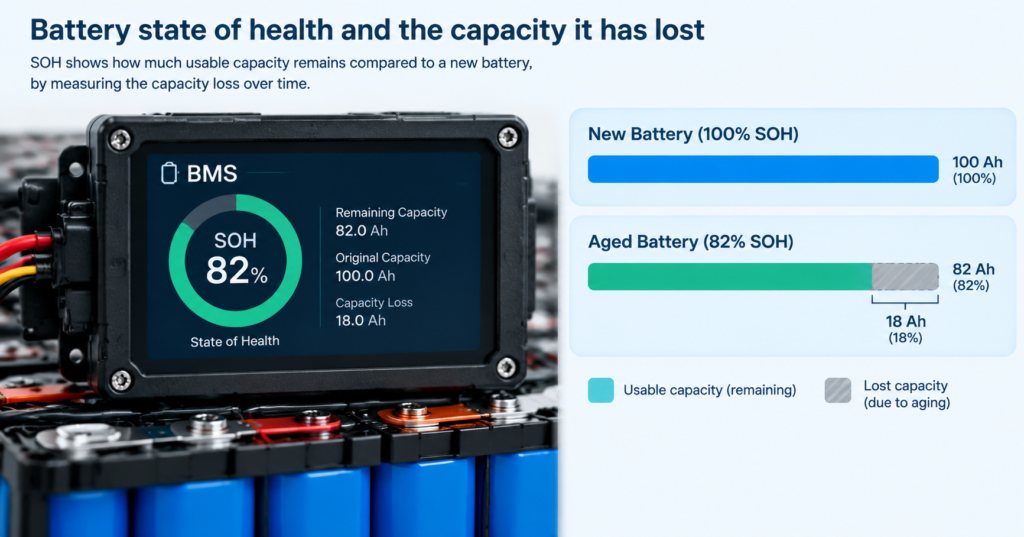
battery state of health is the ratio of a battery’s current maximum capacity to its rated capacity when new, shown as a percentage. A cell leaves the factory near 100% and drifts down with age. State of charge, by contrast, is the instantaneous level — how full the battery is right now. The two answer different questions: SOC says how much energy is on hand this minute, SOH says how much of the original tank remains to be filled.
Confusion is common because dashboards show SOC prominently and hide SOH. A pack at 40% SOC could have SOH of 95% or 70%; SOC says nothing about which. Treating a falling SOC as wear makes operators swap packs that are merely discharged, not degraded. The reliable check is to watch SOH over months, not SOC over an afternoon.
Which two signals does battery state of health actually track?
The first signal is capacity fade — the loss of deliverable ampere-hours between the pack’s allowed voltage limits, as active material ages and lithium gets trapped in side reactions. The second is internal resistance rise, which cuts the pack’s ability to deliver power without voltage sag even when capacity survives.
The two are related but not identical; a cell can lose capacity while resistance holds, or gain resistance while capacity stays, though both usually move together. Some battery management systems report each figure separately, others fold them into one SOH percentage. A blended figure can hide a resistance problem behind an acceptable capacity reading, so tracking both keeps the picture honest.
How is battery state of health measured?
The most direct method is a full charge-discharge capacity test: the pack is charged to its upper limit, then discharged at a defined rate to its lower limit while delivered ampere-hours are summed. Dividing by rated capacity gives SOH with little ambiguity, at the cost of taking the unit offline for a full, controlled cycle.
A faster alternative is a resistance or impedance test, measuring internal resistance with a pulse or AC sweep and comparing it with the new-cell value. It runs online in minutes but is indirect, since temperature and state of charge also move resistance and need correction. The third route is model-based estimation, where the management system builds SOH from cycle history, temperature and coulomb counts, refreshed by the occasional reference test.
| Method | What it measures | When it is used | Trade-off |
|---|---|---|---|
| Capacity (full cycle) | Actual deliverable ampere-hours versus rated | Offline validation and acceptance | Accurate but takes the unit out of service |
| Resistance / impedance | Internal resistance rise versus new | Periodic online check | Fast but indirect and temperature-sensitive |
| Model-based estimate | Blended figure from BMS usage history | Continuous in-field tracking | Convenient but needs periodic recalibration |
What drives battery state of health down over a battery’s working life?
Depth of discharge is the first lever. Cells aged through shallow cycles keep more capacity than cells routinely driven to the bottom of their window; the stress of a deep excursion is repaid in fade. Holding a comfortable depth is among the cheapest ways to protect SOH, and it is a setting the operator controls.
Temperature is the second and often largest driver. Heat accelerates the side reactions that consume active material and grow resistance, so a warm pack ages faster than a cool one. Charge and discharge rate is the third lever: high C-rates push current harder through the same material, raising internal heating. The fourth is calendar aging — even an idle cell slowly degrades, faster when stored hot and at high state of charge. Against this, lithium-ion battery lifespan expectations are best read as a range rather than a fixed date.
How do you read SOH from a BMS, and what counts as a healthy number?
Most battery management systems expose SOH over the communication bus, as a percentage or a capacity value in ampere-hours. Where shown directly, it reads like any other register; where hidden, the capacity register divided by rated value gives the same answer. Good systems timestamp the figure and note whether it came from a live estimate or a recent reference test. Where a reading looks wrong, BMS fault diagnosis separates real fade from a sensor fault, and steady BMS monitoring keeps the trend visible.
What counts as healthy depends on duty, but a widely referenced point is the 80% level. For stationary LFP storage this is the threshold often written into warranty and end-of-life terms: above it the pack still meets its design duty with margin; below it, capacity and power headroom have shrunk enough that the original duty should be rechecked. Exact figures vary by contract and cell type, so the floor should be confirmed against the product’s rated terms. Read as a trend, SOH matters more than any snapshot, and it sits within the broader energy storage lifecycle of the asset.
Where does SOH meet warranty and end-of-life thresholds?
Warranties for storage rarely rest on time alone; many define end-of-life by an SOH floor, so a pack can still run while sitting outside its coverage the moment it crosses that line. The same pack can be serviceable yet no longer under contract, and confusing the two brings surprise at claim time. Tracking SOH lets an operator see the crossing and plan.
End-of-life is an operating decision, not a number handed down by the cells. When SOH falls so far that the pack can no longer meet its required duty inside safe voltage and temperature limits, it is time to repurpose or retire it. Standards such as IEC 62619 frame the safety expectations, but the commercial call belongs to the asset owner. How this compares with how long solar batteries last depends on duty and climate more than on the cells themselves.
How can a deployment slow the loss of battery state of health?
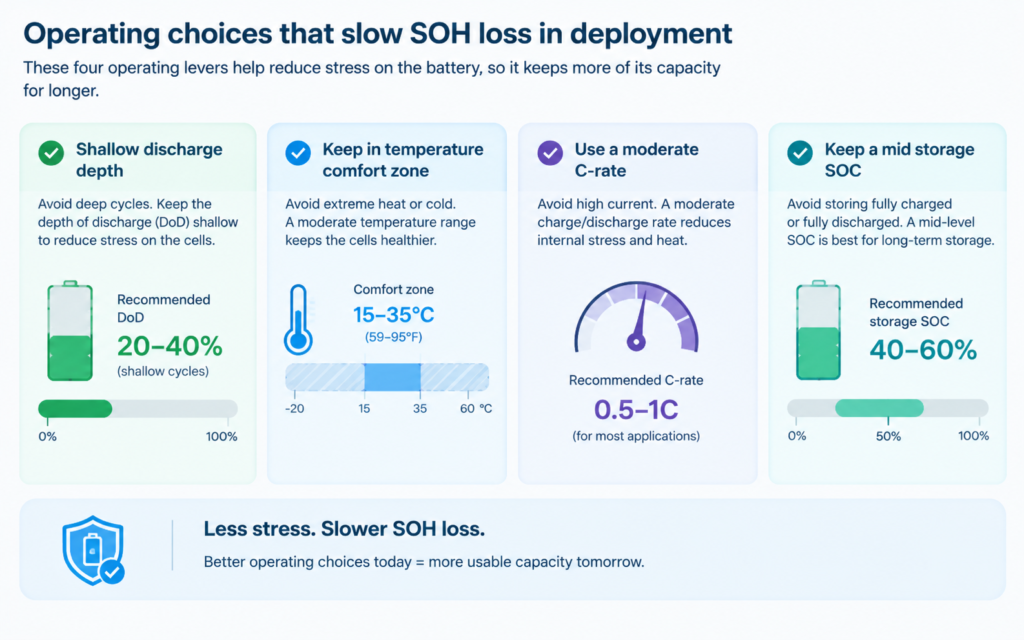
The levers that drain SOH are the same ones that protect it. Limiting depth of discharge keeps cells away from the stressful bottom of their window. Holding the pack inside a comfortable temperature band removes the heat that drives fade, and avoiding sustained high C-rate spares the electrodes hard current. Storing at a moderate state of charge when idle limits calendar aging.
None of these restores lost capacity; battery state of health only moves one direction. What they do is slow the slope, often enough to change when a pack reaches its retirement trigger. The practical form is operating discipline backed by management settings: capped depth, a temperature comfort band, a sane rate limit, and a sensible storage SOC. Paired with routine reference checks, that discipline keeps a fleet’s SOH curve gentle instead of steep.
battery state of health?
battery state of health (SOH) is the share of a battery’s original rated capacity that remains usable. It starts near 100% when new and falls as cells age through cycling and calendar effects. Operators use it to judge whether a pack meets its duty.
Q. How is SOH measured?
SOH is measured three ways. A full charge-discharge cycle gives the most direct capacity figure but takes the unit offline. A resistance or impedance test compares internal resistance to new and is faster. Model-based BMS estimates track it continuously from usage history, needing periodic recalibration.
Q. What is the difference between SOH and SOC?
SOC is the instantaneous charge level — how full the battery is right now. SOH is the long-term condition — how much of the original capacity remains. A battery can show 80% SOC while its SOH is either 95% or 70%; the two answer different questions.
Q. What causes battery capacity fade?
Capacity fade comes from cycling, heat, high charge and discharge rates, and time. Deep discharges and elevated temperature accelerate it most; even an idle cell ages from slow side reactions, faster when stored hot and at high state of charge.
Q. What is a good SOH value for a storage battery?
For stationary LFP storage, an SOH at or above the commonly referenced 80% level is generally considered healthy and within typical warranty terms. Below that, usable capacity and power margin shrink enough that the original duty cycle should be rechecked before relying on it.
Q. Can SOH be restored or improved?
No. Lost capacity and resistance do not reverse in normal use; SOH only trends downward. What operators can do is slow the rate of loss through depth, temperature and rate control, and repurpose a pack rather than expect recovery.
Q. How often should SOH be checked?
A BMS tracking SOH continuously needs no manual check, but a reference capacity test once or twice a year, or after a suspected fault, confirms the model-based number. Frequency depends on duty and warranty terms; confirm the cadence with your service plan.
Request pricing for your project
Send us your usage and site details. For chisidal, we can share product prices, lead time and warranty information. Feel free to contact us for a quote.
- battery state of charge estimation
- battery thermal management system
- For chisidal, send your usage and site details, and we will come back with product prices, lead time and warranty information.